Urblytica 30 days free banner

Fresno, California

USA · Comprehensive city data and intelligence

56
Overall Score

Fresno, California, is a vibrant city located in the heart of the San Joaquin Valley, serving as a major economic hub for the region. Known for its rich agricultural heritage, Fresno is surrounded by some of the most productive farmland in the world, contributing significantly to its economy and cultural identity. The city offers a unique blend of urban amenities and access to natural beauty, with national parks like Yosemite, Sequoia, and Kings Canyon just a short drive away. People are drawn to Fresno for its relatively affordable cost of living compared to other major California cities, its diverse community, and its growing job market, particularly in healthcare and logistics. The city's character is shaped by its agricultural roots, a strong sense of community, and ongoing efforts in urban revitalization, making it an appealing destination for families and professionals alike.

About California

California is a diverse and populous state known for its significant economic output, ranking as the fourth largest economy globally if it were an independent nation. Its economy is driven by major industries such as technology (especially in Silicon Valley), real estate, finance, professional services, manufacturing, agriculture, and healthcare. Living in California generally entails a high cost of living, particularly for housing, which is significantly above the national average. The state boasts a varied climate, ranging from a Mediterranean-like environment with warm, dry summers and mild, wet winters in coastal and central areas, to hotter, drier inland summers and colder, snowier conditions at higher altitudes. The lifestyle often emphasizes outdoor activities, health and wellness, and a diverse cultural experience, though it can also involve considerable traffic in major urban centers.

558,649
Population
$64K
Avg Salary
102
Cost Index
56.0
Quality Score

Businesses in Fresno

Featured local businesses in Fresno.

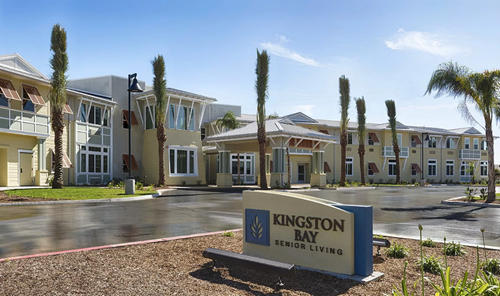
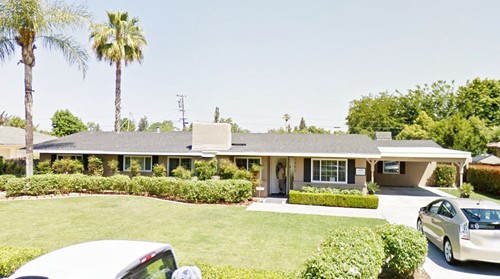
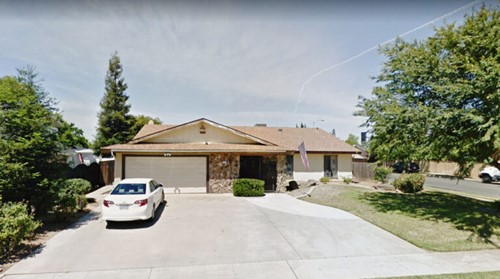
Put your business in front of people moving to Fresno Featured businesses appear here for everyone researching Fresno. Add a featured spot to your banner package, or start with a free listing.

Quality Scores

Business
65
Livability
70
Affordability
75
Growth
72

Cost of Living

The cost of living in Fresno is generally more affordable than the California state average, though it is slightly above the national average, with a cost of living index of 102. Housing costs are a primary driver of this index, being somewhat higher than the national average but significantly lower than in coastal California cities. While rent prices have seen some fluctuations, the median rent for all property types was around $1,675 per month as of September 2026. Other expenses like groceries and transportation also contribute to the overall cost, but the relative affordability of housing makes Fresno an attractive option for those seeking a California lifestyle without the exorbitant price tag of larger metropolitan areas.

Average Rent
$1,675/mo
Groceries
$450/mo
Transport
$150/mo
Utilities
$250/mo
Healthcare
$300/mo
Gym membership (monthly)
$40.00
Cinema ticket
$15.00
Restaurant meal (mid-range)
$20.00
Monthly groceries
$450.00
Doctor visit (without insurance)
$180.00

Salary Insights

Fresno's job market is dynamic, with a diverse economy driven by several key industries. Healthcare and Social Assistance is a leading sector, showing significant job growth and employing a large percentage of the workforce. Agriculture and food processing remain foundational to the region's economy, leveraging the fertile San Joaquin Valley to produce a vast array of crops and related products. The Trade, Transportation, and Utilities sector is also experiencing robust growth, benefiting from Fresno's strategic central location within California, which facilitates efficient logistics and distribution across the state. Manufacturing is another area of focus, with efforts to develop it into a globally competitive resource, while the Leisure and Hospitality sector also contributes to job growth. The average annual salary in Fresno was approximately $63,814 as of May 2025, according to the Bureau of Labor Statistics. The unemployment rate in Fresno County was 7.8% in August 2026, which is higher than the national average.

The average salary in Fresno is $63,814 per year. You would need approximately $75,000 to live comfortably.

Top Industries

Manufacturing +1.00% Leisure and Hospitality +33.00% Trade, Transportation, and Utilities +13.50% Healthcare and Social Assistance +21.10% Agriculture and Food Processing +2.00%

Climate

🌡️
67°F
Avg Temp
☀️
100°F
Summer High
❄️
41°F
Winter Low
🌧️
15.00"
Annual Rain
💧
55.00%
Humidity
🌤️
326
Sunny Days

Transport

Getting around Fresno primarily relies on personal vehicles, reflecting a medium car dependency. The average commute time is around 24.5 minutes. While the city has a public transit system, Fresno Area Express (FAX), its coverage and frequency mean that many residents find driving more convenient for daily errands and commuting. The city's overall walkability score is 47, indicating that most errands require a car. However, specific neighborhoods like the Cultural Arts District and Tower District are considerably more walkable, offering residents the ability to accomplish many tasks on foot. Efforts are ongoing to improve pedestrian and cycling infrastructure, but for now, a car remains essential for navigating the broader metropolitan area.

25 min
Avg Commute
35.00/10
Transit Score
47.00/10
Walkability
Medium
Car Dependency

Pros & Cons

Advantages
More affordable cost of living compared to other major California cities, with a cost of living index of 102.
Strong and growing job market in key sectors like Healthcare and Social Assistance, and Trade, Transportation, and Utilities.
Proximity to major national parks (Yosemite, Sequoia, Kings Canyon) offers abundant outdoor recreational opportunities.
Rich agricultural heritage provides access to fresh, local produce and a unique cultural identity.
Diverse population and community, contributing to a vibrant cultural scene and varied dining options.
Drawbacks
Unemployment rate of 7.8% in August 2026 is higher than the national average.
Car dependency is medium, with an average walk score of 47, meaning most errands require a car.
Some hospitals have received lower safety grades, indicating mixed healthcare quality across facilities.
Median household income of $70,991 is lower than the national median.
Poverty rate of 20.08% is a significant concern.

Questions about Fresno

What people ask about living in and moving to Fresno, California.

What is the typical rent for a one‑bedroom apartment in Fresno? Housing 1 answer

The average rent in Fresno is about $1,675 per month, which includes a range of unit sizes and locations. One‑bedroom apartments in central areas often fall near this average, while smaller units or those farther from the core may be cheaper, and newer or larger units can be higher. To get a precise sense of current listings, check online rental platforms, local classifieds, or contact property management firms. Also...

AI answer Read & reply
How are public schools rated in Fresno? Schools & Education 1 answer

Fresno’s public schools are administered by several school districts that publish performance metrics on their websites. Test scores and graduation rates vary widely across the city, with some schools performing at or above state averages and others below. For detailed, up‑to‑date information, visit the state department of education’s school report card portal or the individual district’s site, where you can compare...

AI answer Read & reply
What’s the climate like year‑round in Fresno? General 1 answer

Fresno experiences a Mediterranean climate with hot, dry summers and mild, wetter winters. Summer daytime highs often exceed 90 °F (32 °C), while winter lows typically stay above 30 °F (0 °C). Rainfall is concentrated in the winter months, and snowfall is rare in the city itself, though nearby mountains receive snow. A light jacket is sufficient for most winter days, but you may need a heavier coat during occasional...

AI answer Read & reply
How does Fresno’s cost of living compare to the national average? Cost of Living 1 answer

Fresno’s cost‑of‑living index is 102, meaning it is roughly 2 % above the national average (which is set at 100). Housing costs are the biggest driver, with the average rent at $1,675 per month. Other expenses such as groceries, utilities, and transportation are close to national norms. Overall, you may find modest savings in some categories but will likely spend a similar amount on housing compared to many other U.S...

AI answer Read & reply
What is the average salary in Fresno and what industries dominate? Jobs & Economy 1 answer

The average annual salary in Fresno is $63,814. The local economy is anchored by agriculture, food processing, education, healthcare, and logistics due to the city’s central location and major transportation corridors. Salaries in these sectors tend to hover around the city average, with some specialized roles paying higher. To gauge competitiveness for logistics positions, review job postings on regional employment...

AI answer Read & reply
Is Fresno a safe place to live? Safety 1 answer

Fresno has a safety score of 55 out of 100, indicating moderate safety concerns relative to other U.S. cities. Crime rates differ by neighborhood, with some areas experiencing higher incidents of property crime and others reporting lower levels. To assess safety for a specific location, consult the city’s police department crime map, review neighborhood watch groups, and check recent resident reviews on community for...

AI answer Read & reply
What public transportation options are available in Fresno? Getting Around 1 answer

Fresno is served by a city transit authority that operates a network of bus routes covering most urban and suburban areas. The system includes regular routes, express lines, and a downtown circulator. While there is no commuter rail within the city, regional rail connections are accessible from nearby stations. For schedules, fare information, and route planning, visit the transit authority’s website or use a transit...

AI answer Read & reply
Where can I find hospitals or urgent care in Fresno? Healthcare 1 answer

Fresno hosts several major hospitals, community health centers, and urgent‑care clinics spread throughout the metropolitan area. These facilities provide emergency services, specialty care, and routine outpatient visits. To locate the nearest provider, use the state health department’s facility locator or the city’s health services directory. Check whether your insurance network includes these hospitals and verify ap...

AI answer Read & reply
What outdoor activities are popular in Fresno? Things to Do 1 answer

Fresno sits near the foothills of the Sierra Nevada, offering easy access to a variety of outdoor recreation. The city maintains numerous parks with walking trails, sports fields, and picnic areas. Within a short drive, you can reach regional forest lands and mountain trails suitable for day hikes, mountain biking, and wildlife viewing. For specific trail maps and conditions, consult the county parks department websi...

AI answer Read & reply
What should I know about moving costs to Fresno? Moving Here 1 answer

Moving to Fresno typically involves transportation costs that depend on distance, volume of belongings, and timing. Because the cost‑of‑living index is only slightly above the national average, you may find that housing costs align closely with your budget if you target the average rent of $1,675. To estimate moving expenses, request quotes from several moving companies, compare insurance options, and consider the pr...

AI answer Read & reply

Answers marked “AI answer” were written by AI as a starting point and may be out of date. Live in Fresno? Add your own answer.

Frequently Asked Questions

California FAQ answer

Urblytica benchmarks its Cost of Living Index against a United States national average baseline of 100. A score of 115 means a city is approximately 15% more expensive than the national average, while a score of 85 indicates it is 15% more affordable. This composite calculation is weighted across six primary expenditure categories: housing, utilities, grocery items, transportation, healthcare, and miscellaneous goods.

Urblytica aggregates housing data from multiple authoritative sources, including Multiple Listing Service (MLS) feeds, municipal property tax registries, the U.S. Census Bureau’s American Community Survey (ACS), and verified historical deed transactions. This multi-tier aggregation ensures precision in tracking median home values and rental rates.

A municipality must meet minimum data-density thresholds—including consistent reporting population samples from the U.S. Census and active residential or commercial real estate transaction feeds—to ensure statistical significance before a complete scoring profile is published.

When primary agencies (such as the Bureau of Labor Statistics or U.S. Census Bureau) issue historical data revisions or benchmark corrections, Urblytica's data pipeline automatically re-indexes affected historical archives to maintain longitudinal trend accuracy.

U.S. affordability calculations incorporate federal income tax brackets, state-specific income tax rates, and local municipal tax variations to evaluate the true net tax drag on median household earnings across different states and cities.

Local county and municipal property tax millage rates are factored directly into the housing component of the cost-of-living index to reflect recurring annual tax burdens for homeowners.

The platform aggregates state sales taxes alongside county and city surtaxes to measure consumer basket purchasing power parity accurately across different retail jurisdictions.

Utility calculations apply regional seasonal consumption weightings, incorporating high summer air conditioning loads in southern states and heavy winter heating demands in northern states.

The index tracks average out-of-pocket healthcare expenses, routine outpatient visit costs, and regional health insurance premium benchmarks published by federal health agencies.

Educational metrics aggregate state standardized testing benchmarks, student-to-teacher ratios, high school graduation rates, and per-pupil expenditure data published by state departments of education.

Safety metrics normalize FBI Uniform Crime Reporting (UCR) data and local police department incident logs into a standardized per-capita index separating violent and property crimes.

Transit scoring evaluates municipal bus line frequencies, light rail proximities, commuter rail station densities, and average daily ridership availability within urban cores.

Environmental indexing incorporates annual clear-sky days, historical Air Quality Index (AQI) readings, and regional natural disaster risk weightings across FEMA flood and wind zones.

Spatial analysis tools calculate the percentage of residential populations living within a 10-minute walk of a public park alongside total protected municipal park acreage.

U.S. business climate indexes track state-level Secretary of State LLC and corporate filing fees, state corporate income tax structures, franchise taxes, and local commercial zoning compliance requirements.

Startup ecosystems are indexed by tracking regional venture capital deal volume, angel investor network density, and tech incubator counts relative to regional business formations.

The platform maintains an index of state-level economic development programs, including job creation tax credits and research and development (R&D) tax exemptions that lower operational overhead.

Commercial real estate analytics aggregate average price-per-square-foot lease rates for office, retail, and industrial properties alongside local vacancy rate trends.

Workforce readiness tracks local university graduation counts in STEM disciplines, vocational training program completions, and adult educational attainment levels.

Real estate analytics integrate monthly Multiple Listing Service (MLS) transaction data, county deed registries, and federal housing finance agency home price indices to track median home sale values.

The ratio divides median annual gross rent by local median household income to identify housing affordability levels relative to the standard 30% gross income threshold.

Market balance is determined by months of inventory (MOI), where inventory under 4 months designates a competitive seller's market and inventory over 6 months indicates a buyer's market.

Average monthly HOA dues are integrated into the "Total Cost of Homeownership" metric alongside effective property tax millage rates to represent recurring monthly expenses accurately.

Yes. The platform maintains multi-year historical archives for median home values, building permits, and zoning changes to support long-term investment research.

U.S. data models rely on primary federal sources including the U.S. Census Bureau American Community Survey (ACS), Bureau of Labor Statistics (BLS) local area statistics, and Bureau of Economic Analysis (BEA) metrics.

Real estate values are updated monthly, cost-of-living consumer baskets are recalibrated quarterly, and demographic and tax scores are audited annually against federal census updates.

Normalization adjusts raw municipal data against population density scales and regional purchasing power parities (PPPs) to ensure fair comparisons between major cities and small towns.

No. All rankings, indices, and market scores are designed for informational, research, and comparative purposes only and do not constitute formal financial, tax, or legal advice.

When agencies like the BLS or Census Bureau issue historical revisions, Urblytica's data pipeline automatically re-indexes affected historical archives to maintain longitudinal accuracy.

The job market health index aggregates regional employment growth rates, unemployment trends, industry diversification scores, and median wage growth velocity.

Remote work scoring measures municipal fiber-optic penetration, commercial co-working space density, and average residential broadband speeds.

Platform stability tracking monitors rolling 12-month unemployment rates relative to national averages and labor force participation trends.

Net compensation analysis adjusts gross regional salary offers by factoring in state income tax brackets and payroll deductions to calculate actual take-home pay.

Yes. Professional networking vitality is quantified by tracking regional trade conventions, active local chambers of commerce, and university alumni networking chapters.

Safety metrics normalize municipal and county law enforcement records into a standardized Safety Index per 1,000 residents, separating violent crimes from property offenses.

Pedestrian metrics measure sidewalk network coverage, intersection density, dedicated pedestrian crossing signals, and proximity to everyday commercial destinations.

Environmental quality tracking incorporates local Air Quality Index (AQI) historical averages, particulate matter concentrations, and municipal drinking water safety compliance reports.

Green space accessibility calculates residential populations living within a 10-minute walk of a public park alongside total protected park acreage and multi-use trail networks.

Healthcare indexing maps geographic distributions and per-capita counts of primary care clinics, 24/7 emergency rooms, and specialized hospitals relative to residential density.

Users select two or more municipal profiles simultaneously to generate a comparative matrix contrasting cost-of-living differentials, tax drag, median housing values, and commute lengths.

Yes. Registered users can save custom city shortlists, pin preferred economic indicators, store tailored cost-of-living calculators, and export consolidated reports.

Users with qualifying account tiers can export clean, structured datasets and comparison summaries into standard formats such as CSV, Excel spreadsheets, or PDF report packages.

Urblytica offers structured API access tiers designed for proptech developers and enterprise analysts, providing programmatic endpoints for real-time city indexing and demographic feeds.

Users are advised to clear browser cache and cookies, disable aggressive ad-blockers that interfere with mapping scripts, or switch to a modern standards-compliant browser.

The consumer market basket tracks everyday necessities, including staple grocery items (such as milk, bread, eggs, and produce), residential energy bills (electricity, gas, and water), public and private transit costs, routine outpatient medical care, and standard consumer goods and services to ensure a representative monthly budget.

Even in close geographic proximity, local tax jurisdictions, municipal utility rates, zoning laws, and micro-housing markets can create wide cost discrepancies. For example, a city with strict land-use regulations or higher local sales taxes will typically exhibit elevated housing and consumer goods costs compared to an adjacent county with looser zoning and lower tax burdens.

Even in close geographic proximity, local tax jurisdictions, municipal utility rates, zoning laws, and micro-housing markets can create wide cost discrepancies. For example, a city with strict land-use regulations or higher local sales taxes will typically exhibit elevated housing and consumer goods costs compared to an adjacent county with looser zoning and lower tax burdens.

Local tax climates significantly shift a city's affordability score by directly affecting disposable income. Urblytica factors in state income tax brackets, local municipal property tax millage rates, and combined sales taxes to measure the true tax drag on median household earnings.

Core economic indexes and consumer price metrics undergo a comprehensive quarterly recalibration. This update cycle integrates the latest Consumer Price Index (CPI) releases, municipal utility rate adjustments, and regional housing data feeds to ensure all index comparisons reflect current economic conditions.

Housing is weighted as the single largest component in Urblytica's cost-of-living algorithm, typically accounting for roughly 30% to 35% of the composite score. It incorporates both median monthly gross rent and median single-family home purchase prices relative to local median income levels.

Normalization involves adjusting raw economic inputs against localized purchasing power parities (PPPs) and population-weighted density scales. This ensures fair, apples-to-apples comparisons between dense metropolitan hubs and smaller suburban or rural towns.

Utility indexing applies a rolling annual average that captures seasonal climate variations, such as increased summer air conditioning loads in southern climates or heavier winter heating demands in northern regions, providing a realistic year-round average utility expense.

Remote workers leverage the index to calculate real purchasing power parity when moving from a high-cost-of-living area to a lower-cost region. By comparing index differentials against their fixed salary, users can determine if their net savings and lifestyle quality will improve post-relocation.

While the raw Cost of Living Index measures pure expense levels, it is frequently paired with Urblytica’s local wage index and median household income benchmarks. This combined view highlights whether local salaries keep pace with local consumer goods and housing expenses.

Urblytica normalizes municipal, county, and state law enforcement reporting data into a unified Safety Index scaled per 1,000 residents. The algorithm decouples violent offenses from property crimes to give movers a granular view of specific risk factors when comparing neighborhoods or suburbs.

Rankings are driven by demographic-specific weighting models. For families, the platform weights school performance, park acreage, and pediatric healthcare access heavily. For retirees, it prioritizes sunshine hours, healthcare proximity, and property tax exemptions. For young professionals, it measures walkability, nightlife density, high-speed fiber availability, and rental market velocity.

Educational metrics aggregate state standardized test scores, student-to-teacher ratios, high school graduation rates, and per-pupil expenditures across local public school districts, alongside proximity options for charter and private school alternatives.

The side-by-side comparison tool overlays a user's baseline parameters—such as target income, remote work status, or household size—across two selected municipal datasets. It calculates direct percentage differentials in housing, tax drag, weather indices, and commuting times to output a net lifestyle impact score.

Mobility scores integrate geographic transit stop densities, pedestrian sidewalk coverage, dedicated bike lane miles, and average commute durations using spatial analysis feeds to measure a city's reliance on personal automobile ownership.

Environmental indexing factors in annual clear-sky days, average seasonal temperature extremes, historical air quality index (AQI) readings, and natural disaster risk weighting (such as flood zones or seismic activity) to reflect year-round livability comfort.

Cultural vibrancy is measured by per-capita counts of museums, performing arts venues, public libraries, local dining establishments, and community festival spaces, ensuring users can gauge the social and recreational vibrancy of a metro area.

Yes. Urblytica’s interactive custom weighting engine allows users to slide importance parameters—such as prioritizing low taxes over public transit or warm weather over proximity to major airports—to dynamically re-rank cities to their personal preferences.

The platform monitors net domestic migration figures, building permit issuances, and municipal census updates to track whether a city is expanding rapidly, stabilizing, or experiencing population contraction, which directly affects long-term community infrastructure.

Park accessibility is calculated using spatial proximity buffers (such as the percentage of residents living within a 10-minute walk of a public park), total acreage of protected green spaces, and recreational trail networks available for public use.

Urblytica’s Business Climate Score is a composite index built on regional corporate tax rates, municipal business filing fees, local labor market talent density, venture capital funding volume, regulatory friction, and commercial real estate availability. This provides entrepreneurs and investors with an objective measure of municipal startup friendliness.

High state corporate income taxes and costly annual municipal registration fees can deter early-stage bootstrapping. Urblytica tracks these structural costs alongside state-level tax incentives, franchise taxes, and LLC formation fees to calculate the true cost of establishing and maintaining legal business operations in a specific jurisdiction.

Top-tier hubs for investment and talent readiness are typically anchored by major research universities, high concentrations of STEM graduates, robust angel investor networks, and mature incubators or accelerators. Urblytica ranks these metro areas by matching local university output against active regional venture capital deployments.

Founders analyze Urblytica’s sector-specific growth metrics—such as local per-capita spending, industry-specific employment density, and regional business formation rates—to gauge market saturation, validate target customer demand, and identify underserved niches for expansion.

Talent pipeline readiness measures the steady influx of skilled labor from local colleges, universities, and vocational programs. Cities with high concentrations of specialized degree holders receive higher weightings because they reduce recruitment overhead and skill-gap friction for growing companies.

Commercial real estate metrics evaluate average price-per-square-foot lease rates for retail, industrial, and co-working spaces, alongside vacancy rates. Affordable commercial leasing options significantly elevate a city's score for small-to-medium enterprises (SMEs) and retail startups.

Yes. The platform maintains a dynamic index of regional economic development programs, including state job creation tax credits, R&D tax exemptions, municipal small business grants, and enterprise zone incentives that lower operational overhead for qualifying companies.

Regulatory friction is quantified by analyzing the average timeline and procedural complexity required to secure local commercial building permits, zoning variances, occupational licenses, and health inspection clearances, highlighting markets with streamlined bureaucratic processes.

High-growth ecosystems are characterized by dense networks of venture capital firms, angel syndicates, tech-focused accelerators, and scalable business models. Traditional small-business economies rely more heavily on steady local consumer demand, service-oriented retail, and localized commercial stability.

Commercial viability heavily incorporates digital and physical infrastructure metrics, including enterprise-grade fiber-optic broadband availability, proximity to major interstate corridors, cargo airports, and public freight networks necessary for efficient supply chain management and digital operations.

The Rent-to-Income ratio divides the median annual gross rent by the local median household income. Urblytica benchmarks this against the standard financial guideline where housing costs should ideally not exceed 30% of gross household income, highlighting markets experiencing rent burden versus those offering high affordability.

Leading indicators include months of inventory (MOI), apartment absorption rates, new multifamily building permit issuances, year-over-year median rent growth velocity, and net population migration into the specific municipal core.

Home appreciation tracking uses repeat-sales indices and median price-per-square-foot trend analysis over 1-year, 3-year, and 5-year rolling windows. This isolates true market value appreciation from structural shifts in the types of homes being sold.

Market balance is determined primarily by months of inventory (MOI). An inventory level under 4 months designates a competitive seller's market, 4 to 6 months indicates a balanced market, and an inventory exceeding 6 months signifies a buyer's market characterized by greater negotiating leverage and higher days-on-market averages.

Beyond base purchase prices or monthly rent, Urblytica incorporates effective property tax millage rates and average monthly HOA dues into its "Total Cost of Homeownership" metric. This provides buyers with an accurate representation of recurring monthly holding costs.

Commercial real estate tracking covers average cap rates, net absorption, vacancy rates, and asking lease prices across retail, office, and industrial sectors. This gives real estate investors a holistic view of urban economic health and development momentum.

Housing stability is assessed by tracking historical foreclosure rates, owner-occupancy percentages versus investor-owned rental concentrations, employment diversification, and historical price volatility during broader macroeconomic recessions.

Investors leverage the platform's gross rental yield calculations—derived by dividing annual gross rental income by purchase price—alongside population growth velocity and infrastructure investment announcements to spot high-potential emerging markets.

Yes. The platform maintains multi-year historical archives for median home values, rent trajectories, building permits, and zoning changes, allowing users and analysts to backtest market performance and project long-term real estate trends.

Core metrics undergo scheduled synchronization cycles depending on the data feed: real estate market values and housing inventories are updated monthly, cost-of-living indices and consumer baskets are recalibrated quarterly, and comprehensive demographic, tax, and economic climate scores are audited annually against federal census updates.

Urblytica builds its data models using authoritative primary sources, including the U.S. Census Bureau (American Community Survey), Bureau of Labor Statistics (BLS), federal and state Department of Labor metrics, Multiple Listing Service (MLS) transactional feeds, municipal tax registries, and peer-reviewed economic research databases.

Normalization is executed via algorithmic weighting models that adjust raw municipal data against population density scales, purchasing power parities (PPPs), and regional cost adjustments. This ensures fair, apples-to-apples comparisons between major metropolitan centers and rural or micropolitan communities.

No. All rankings, indices, cost-of-living projections, and market scores provided by Urblytica are designed for informational, research, and comparative purposes only and do not constitute formal financial, real estate investment, tax, or legal advice.

User-submitted insights and external partner integrations pass through automated validation filters, outlier detection algorithms, and manual editorial checks against baseline federal and state datasets before being integrated into live public profiles.

The platform publishes comprehensive methodology guides detailing how index categories (such as cost of living, safety, and business climate) are weighted and calculated, empowering researchers and users to inspect the exact mechanics behind every ranking.

Yes. Qualified researchers, proptech developers, and media outlets can request access to Urblytica’s data feeds and API integration tiers for academic studies, market research reports, and custom geospatial data applications.

Urblytica's platform models are governed by a specialized team of data architects, software engineers, and urban economists dedicated to maintaining rigorous statistical standards, data privacy compliance, and transparent analytical practices across all digital properties.

Urblytica’s job market health index aggregates regional employment growth rates, unemployment trends, industry diversification scores, median wage growth velocity, and the presence of major corporate headquarters or academic medical centers. This allows professionals to assess long-term career resilience and upward mobility potential.

Wage growth metrics compare annual percentage increases in median household income against regional inflation and cost-of-living indices. This reveals whether local earnings outpace consumer price increases, providing a true measure of real purchasing power improvement for workers moving into the area.

The platform indexes regional employment concentrations by matching Bureau of Labor Statistics (BLS) data with local business registry feeds, tracking key economic drivers such as tech, healthcare, aerospace, finance, or advanced manufacturing to identify dominant hiring sectors.

Remote work infrastructure scoring measures municipal fiber-optic penetration, commercial co-working space density, average residential download/upload speeds, and digital nomad friendliness, reflecting a city's viability for distributed teams and remote professionals.

Labor stability tracking monitors rolling 12-month unemployment rates relative to national averages, alongside labor force participation trends, indicating how quickly displaced workers can re-enter the workforce or how competitive local hiring environments are.

Yes. Urblytica’s interactive search filters allow professionals to isolate cities based on specific sector strengths—such as filtering exclusively for top-tier biotechnology hubs, fintech centers, or engineering-heavy municipal markets.

Ecosystem composition indexing calculates the ratio of early-stage venture-backed startups and small businesses versus Fortune 500 or large enterprise employers, helping job seekers choose between the high-growth environment of a startup or the career stability of a legacy corporation.

Net compensation analysis adjusts gross regional salary offers by factoring in state income tax brackets, local occupational privilege taxes, and state-specific payroll deductions, providing workers with an accurate calculation of their actual take-home pay.

Professional networking vitality is quantified by tracking the frequency of regional trade conventions, active local chambers of commerce, industry-specific meetup groups, and university alumni networking chapters operating within the municipal boundary.

Yes. The platform tracks the percentage of the adult population holding bachelor's degrees, graduate degrees, or specialized technical certifications, indicating a region's intellectual capital and the overall skill sophistication of its labor pool.

Urblytica normalizes municipal, county, and state law enforcement records into a standardized Safety Index per 1,000 residents, separating violent crimes from property offenses to give users clear risk assessments across different zip codes and neighborhoods.

Pedestrian metrics measure sidewalk network coverage, intersection density, dedicated pedestrian crossing signals, and proximity to everyday commercial destinations like grocery stores, pharmacies, and public parks.

Public transit scoring aggregates local bus route frequencies, rail or subway station proximities, transit stop densities, and average daily schedule availability to measure how easily residents can navigate the city without a personal vehicle.

Environmental quality tracking incorporates local Air Quality Index (AQI) historical averages, particulate matter concentrations ($PM_{2.5}$ and $PM_{10}$), municipal drinking water safety compliance reports, and industrial emissions tracking provided by environmental protection databases.

Green space accessibility calculates the percentage of residential populations living within a 10-minute walk of a public park, alongside total protected park acreage, community sports fields, and paved multi-use trail networks.

Yes. Urban density and nuisance metrics analyze population density per square mile, traffic volume acoustic mapping, and light pollution indices to help residents gauge the ambient noise and tranquility levels of specific neighborhoods.

Disaster risk modeling evaluates historical hazard frequencies—such as flood zones, wildfire exposure, hurricane paths, or seismic fault lines—alongside municipal emergency response infrastructure and flood mitigation investments.

Civic vitality is assessed through voter turnout rates in local municipal elections, active neighborhood association counts, public library utilization numbers, and community volunteer participation rates.

Health infrastructure indexing maps the geographic distribution and per-capita counts of primary care clinics, 24/7 emergency rooms, specialized hospitals, urgent care centers, and community fitness facilities relative to residential density.

Yes. Urblytica’s customizable weighting interface enables users to prioritize specific lifestyle metrics—such as weighting low crime rates and top-tier school districts higher than nightlife or public transit density—to generate personalized neighborhood scores.

Users can select two or more municipal profiles simultaneously to generate a side-by-side comparative matrix. The interface contrasts key metrics—such as cost-of-living differentials, tax drag, median housing values, and commute lengths—to help users evaluate relocation choices.

Yes. Registered users can save custom city shortlists, pin preferred economic indicators, store tailored cost-of-living calculators, and export consolidated reports directly from their user dashboard for easy future access.

Platform users with qualifying account tiers can export clean, structured datasets and comparison summaries into standard formats such as CSV, Excel spreadsheets, or PDF report packages for offline research and presentations.

Urblytica offers structured API access tiers designed for proptech developers, enterprise analysts, and academic researchers, providing programmatic endpoints for real-time city indexing, demographic data feeds, and historical market metrics.

Users can adjust interactive weighting sliders within the custom ranking dashboard to prioritize personal preferences—such as emphasizing high-speed broadband and low income taxes over warm weather or public transit—to dynamically re-sort city leaderboards.

Users can initiate an account recovery by clicking the "Forgot Password" link on the login portal, entering their registered email address, and following the secure cryptographic token link sent to their inbox to establish a new password.

Urblytica enforces strict data privacy standards by utilizing encrypted HTTPS transmission protocols, secure database hashing for credentials, and full compliance frameworks allowing users to request data access, modification, or complete account deletion under privacy regulations.

Enterprise clients, media outlets, and institutional researchers can reach out directly via the platform’s "Enterprise & Partnership" contact portal to coordinate custom geospatial analyses, bulk data licensing, or tailored API integrations.

If interactive elements fail to load, users are advised to clear browser cache and cookies, disable aggressive ad-blockers or script-blocking extensions that may interfere with mapping scripts, or switch to a modern standards-compliant browser.

Users can submit feedback, bug reports, or feature recommendations through the in-app support ticketing system or the "Feedback & Suggestions" portal, where product and engineering teams regularly review submissions for platform enhancements.
Azibiz.com Live Listings

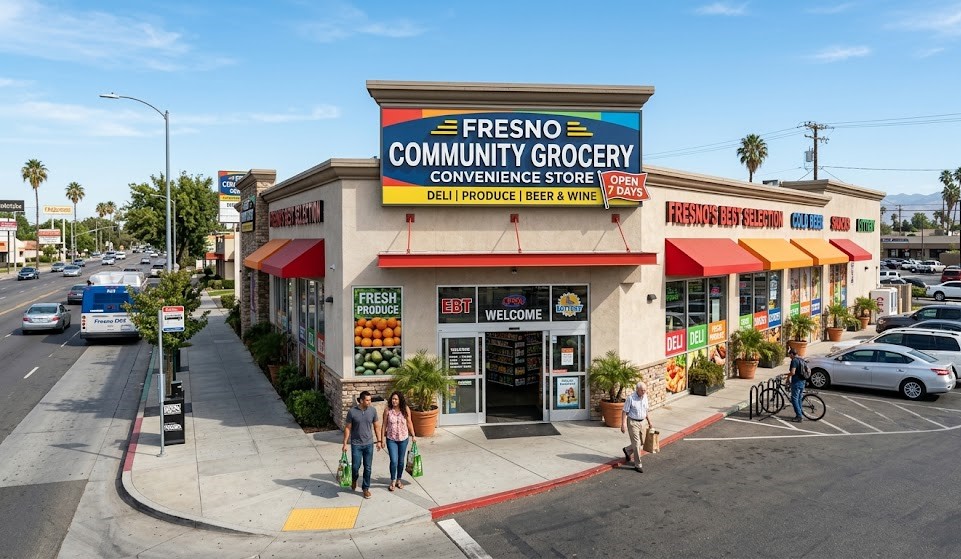
Businesses for Sale in Fresno

Explore active acquisition & franchise opportunities .
View all California listings

Get quotes from local pros in Fresno

Tell us what you need and we’ll pass it to companies that serve your area. It’s free, and there’s no obligation.

New to Fresno? Get settled

Find trusted local pros

Construction, cleaning & moving — matched to verified professionals in Fresno.

Free service • No obligation • We connect you with local professionals.

Disclaimer: By submitting this form you agree that we may share the details you provide — including your name, email and ZIP code — with the matched professionals and companies in Fresno, CA so they can contact you about your request. Urblytica does not perform the work itself and is not a party to any agreement you make with them. See our Privacy Policy.

Compare Fresno with any city

See how it stacks up on cost, income, and quality of life.

Start Comparing

Sponsored