


Cities with Highest Median Income: A Deep Dive Economic Analysis for 2026
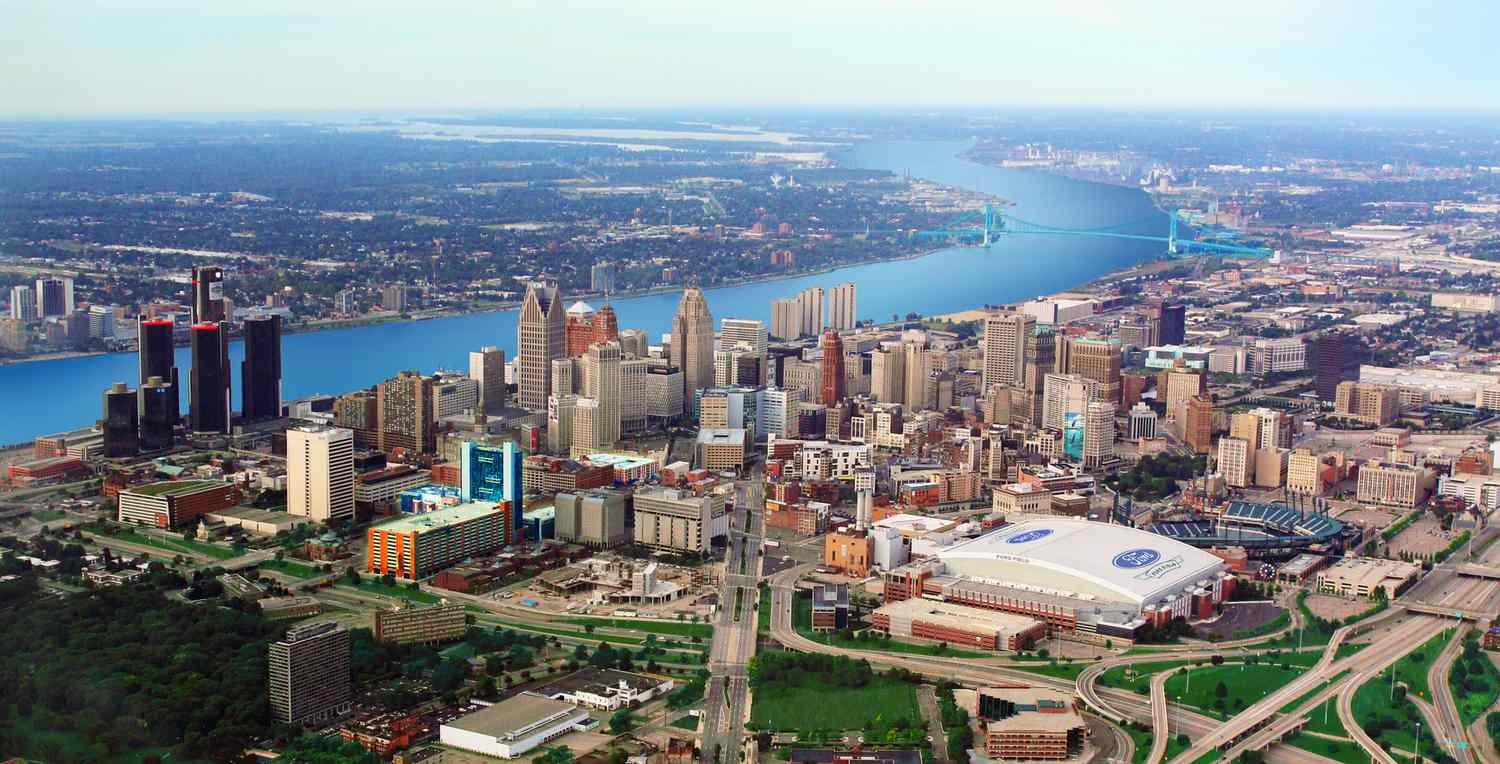
The contemporary American economic landscape is defined by a distinct concentration of wealth, innovation, and professional capital within specific urban corridors. In 2026, the cities with the highest median income are serving as the primary engines of national economic growth. These urban hubs represent more than just high cost living environments; they are sophisticated economic ecosystems where high skill labor, venture capital, and cutting edge business infrastructure converge to create exceptional prosperity. For professionals, entrepreneurs, and investors looking to navigate these markets, understanding the nuanced data behind urban wealth is essential for strategic planning and long term success.
The Analytical Framework of Urban Prosperity
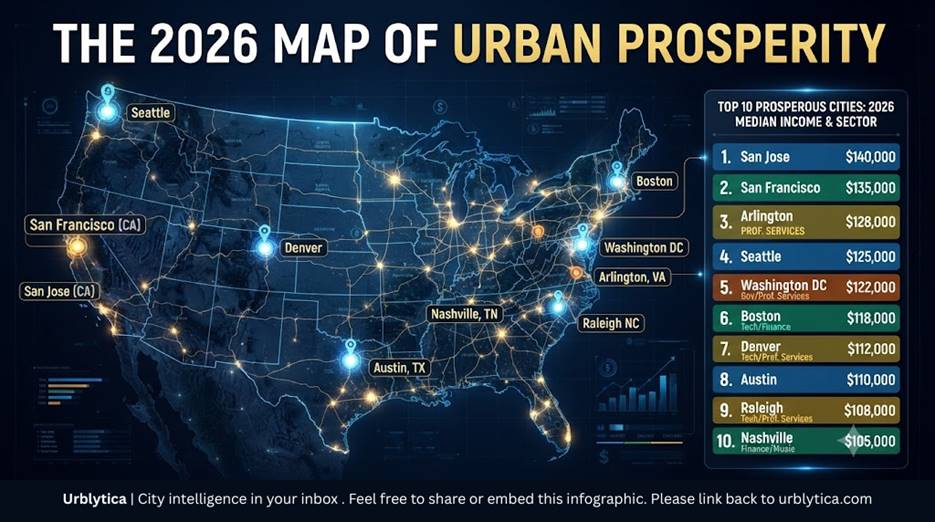
To accurately measure the prosperity of a city, we must look beyond mere nominal figures. Median household income is the most critical metric because it provides a realistic representation of the baseline for a typical household, stripping away the distortions created by the extreme wealth of a tiny percentage of the population. When we analyze these hubs, we look at the purchasing power of the middle to upper class population, which acts as the core driver for local demand and economic activity.
In cities like San Jose, California, the income landscape is skewed upward by the intense density of the technology sector, creating an environment where baseline compensation is significantly higher than in secondary markets. For deeper city level insights, visit Urblytica’s City Intelligence Dashboard. When analyzing these markets, it is crucial to recognize that high median income is often correlated with specialized industries rather than generalized economic growth. To determine the real economic value, analysts must calculate the purchasing power adjusted for local costs, effectively measuring the actual disposable income available to residents.

In this formulation, S denotes the base salary, T denotes the local tax liability, and P denotes the purchasing parity index. This economic analysis is fundamental for businesses attempting to gauge the viability of market entry and scalability in high income regions.
The Structural Drivers of Urban Wealth
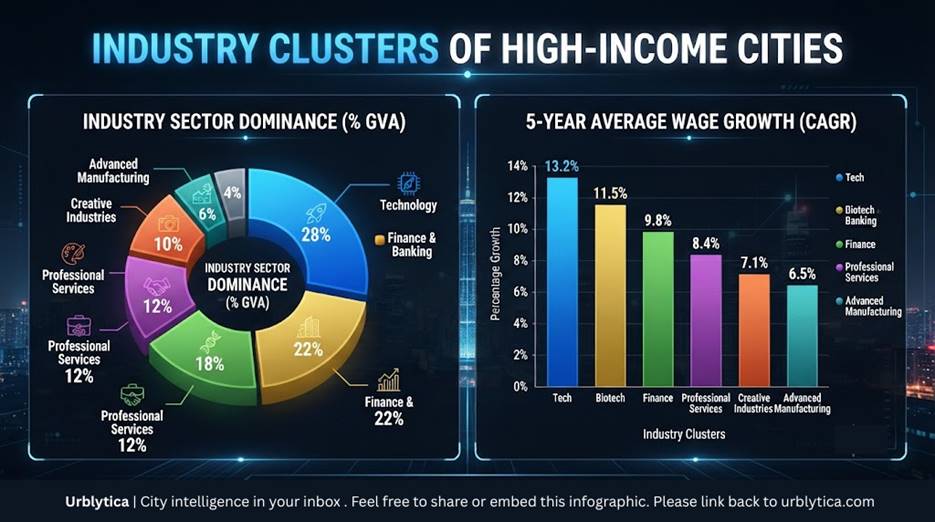
The concentration of wealth in specific cities is a result of several macro economic trends that have accelerated significantly over the past half decade. First, the dominance of the technology and finance sectors has created a tier of salaries that are decoupled from traditional inflationary patterns. Second, the integration of advanced business services in urban hubs has streamlined high level corporate operations, allowing for greater efficiency and higher profit margins for firms based in these hubs.
The Innovation and Technological Cluster Effect
Technology driven cities exhibit a distinct wage premium. In San Francisco, California, the concentration of venture capital and software engineering firms creates a labor market that commands top tier compensation. For deeper city level insights, visit Urblytica’s City Intelligence Dashboard. This ecosystem attracts top tier talent from across the globe, effectively creating a feedback loop of prosperity where high wages support high end local businesses, which in turn attract even more wealth.
Financial and Professional Service Hubs
Cities such as Charlotte, North Carolina, and New York City have solidified their positions as the primary repositories of financial capital. For deeper city level insights, visit Urblytica’s City Intelligence Dashboard. The demand for sophisticated accounting and finances services in these regions is a direct consequence of complex corporate operations based within these city limits. As these firms expand, they require a constant influx of high earning professionals, maintaining the median income at levels far above the national average.
Data Overview of Top Earning Cities 2026
The following grid table illustrates the correlation between median household income and the primary industrial drivers across the top ten US cities in 2026. This data serves as the foundation for understanding the economic hierarchy within the nation.
|
City |
Median Household Income |
Primary Industrial Sector |
Economic Resilience |
|
San Jose |
$152,000 |
Technology |
Exceptional |
|
San Francisco |
$138,000 |
Finance/Tech |
High |
|
Arlington |
$131,000 |
Professional Services |
High |
|
Seattle |
$126,000 |
Cloud Computing |
High |
|
Washington DC |
$120,000 |
Government/Policy |
Moderate |
|
Boston |
$115,000 |
Biotechnology |
Exceptional |
|
Denver |
$108,000 |
Aerospace/Defense |
High |
|
Austin |
$102,000 |
Software/Innovation |
High |
|
Raleigh |
$98,000 |
Research/Academia |
Moderate |
|
Nashville |
$95,000 |
Healthcare/Music |
Moderate |
The Housing Affordability Paradox
One of the most persistent issues in cities like Boston, Massachusetts, is the high cost of housing relative to income. For deeper city level insights, visit Urblytica’s City Intelligence Dashboard. While median incomes appear high in nominal terms, the real purchasing power is often diminished by the escalating costs of residential real estate. This creates a paradox where residents may earn more but have less disposable income than those living in more affordable markets.
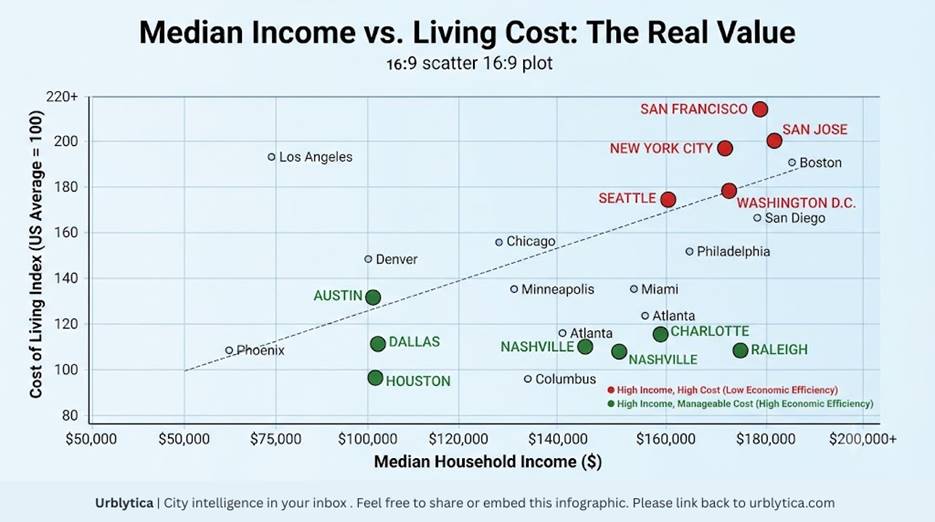
Businesses looking to relocate must consider the impact of these costs on their employees. Using a relocation cost calculator is a standard practice for firms attempting to maintain competitive compensation packages while managing their own operational overheads.
Economic Cost Metrics and Comparative Data
The following table provides an assessment of the relationship between median income and local living costs across major markets, highlighting the disparity in wealth and expenses.
|
City |
Cost of Living Index |
Average Rent |
Median Home Price |
Business Climate |
|
San Jose |
185 |
$3,200 |
$1,400,000 |
Advanced |
|
San Francisco |
192 |
$3,500 |
$1,350,000 |
Competitive |
|
Arlington |
145 |
$2,400 |
$850,000 |
Stable |
|
Seattle |
155 |
$2,300 |
$900,000 |
Growth Oriented |
|
Boston |
160 |
$2,800 |
$950,000 |
Innovative |
Business Formation Strategies in High Income Markets
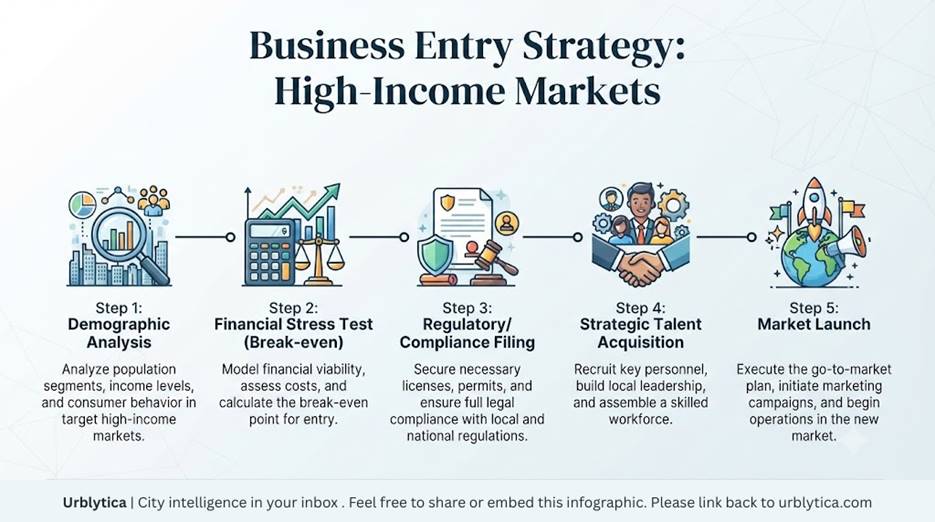
For an entrepreneur, identifying a high income city to start a business is an exercise in precise market segmentation. In affluent environments like Austin, Texas, the consumer base is highly receptive to premium services. For deeper city level insights, visit Urblytica’s City Intelligence Dashboard.
However, entering these markets requires substantial due diligence. The regulatory overhead in states with high income hubs is often complex, requiring a structured approach to compliance. Entrepreneurs should rely on professional business filing services to ensure compliance. When you buy a business in these regions, you are essentially purchasing a premium customer list, which necessitates a different valuation approach than in secondary or tertiary markets where volume is the primary metric for growth.
Operational Cost Comparison
|
City |
Corporate Tax Rate |
Talent Availability |
Regulatory Score |
Infrastructure |
|
San Jose |
Moderate |
Exceptional |
High |
Very High |
|
San Francisco |
High |
Exceptional |
High |
High |
|
Arlington |
Moderate |
High |
Moderate |
High |
|
Seattle |
Low |
High |
Moderate |
High |
|
Washington DC |
High |
Moderate |
High |
High |
The Role of Specialized Demand and Demographic Shifts
The demand for specialized services is an emergent trend in high income regions. As the median age rises in affluent cities like Nashville, Tennessee, the demand for health and senior care grows significantly. For deeper city level insights, visit Urblytica’s City Intelligence Dashboard.
Investors who monitor senior care statistics are often the first to identify new opportunities in the care economy. This sector is particularly resilient to economic fluctuations, as the necessity for high quality care is inelastic. The integration of technology into these service models is providing high profit margins for firms that can scale effectively within these affluent demographics.
The Impact of Education on Economic Mobility
There is a statistically significant correlation between the presence of elite research institutions and a city's long term median income trajectory. In Raleigh, North Carolina, the proximity to the Research Triangle Park has created a permanent economic base. For deeper city level insights, visit Urblytica’s City Intelligence Dashboard.
Cities that effectively foster partnerships between universities and the private sector tend to retain top tier talent, which in turn fuels the local economy. This is a critical component of urban intelligence that business owners must track. When looking at long term investments, one must also account for population growth. Use a population growth calculator to predict where the next cycle of high wage job creation will occur.
Growth and Mobility Projections
|
City |
5-Year Income Growth |
Population Mobility |
Education Score |
Innovation Index |
|
San Jose |
4.2% |
Low |
98 |
99 |
|
San Francisco |
3.8% |
Moderate |
96 |
97 |
|
Austin |
5.1% |
High |
92 |
94 |
|
Seattle |
4.5% |
High |
95 |
96 |
|
Denver |
3.9% |
High |
90 |
91 |
Financial Modeling for Business Scalability
Entrepreneurs in these environments must understand the mechanics of scaling a company. A common mistake is failing to calculate the breakeven point in a high rent environment. Use a break even calculator to stress test your business model before committing to a lease in a prime location. For deeper city level insights, visit Urblytica’s City Intelligence Dashboard.
In high income hubs, fixed costs are significantly elevated. Businesses that succeed in these zones often adopt a lean operational model, leveraging outsourced business services to keep overheads manageable.
Future Trends: The Decentralization of Wealth
While coastal hubs have historically dominated, we are seeing a shift. The rise of remote capable, high skill work has allowed professionals to migrate to secondary cities, effectively raising the median income in locations like Raleigh and Nashville. For deeper city level insights, visit Urblytica’s City Intelligence Dashboard.
This redistribution of wealth is a long term trend. Businesses that anticipate this shift are positioning themselves in markets where the cost of living is lower, but the talent pool is rapidly expanding. This balance is often the key to maximizing profit margins over the coming decade.
The Role of Infrastructure and Civic Policy
The physical and digital infrastructure of a city acts as a backbone for its economic growth. In cities like Arlington, Virginia, the heavy investment in public transit and high speed broadband has directly contributed to its competitive edge in attracting professional services firms. For deeper city level insights, visit Urblytica’s City Intelligence Dashboard.
Infrastructure does not just mean roads and bridges; it includes the regulatory environment. Cities that maintain a favorable business climate characterized by reasonable permitting processes and responsive governance consistently show higher rates of business creation. This is a vital metric for any investor evaluating the future of a specific municipality.
Understanding Consumer Behavior in Affluent Regions
In markets where the median income is high, consumer behavior changes significantly. There is a higher demand for convenience, quality, and personalized experiences. For deeper city level insights, visit Urblytica’s City Intelligence Dashboard.
Businesses in these regions often pivot away from low cost, volume based models towards premium, experience based models. Whether it is in retail, real estate, or dining, the expectation for superior service is the norm. For a company planning to scale, aligning brand values with this expectation of quality is mandatory.
Long term Investment and Economic Cycles
It is important to remember that high median income does not make a city immune to economic cycles. Even in the most prosperous cities like Seattle and Washington, shifts in the global tech market can cause temporary labor market corrections. For deeper city level insights, visit Urblytica’s City Intelligence Dashboard.
Smart capital allocation involves looking at the 5 year and 10 year outlook for these urban centers. Entrepreneurs and investors should focus on locations that demonstrate diversified economic engines rather than those overly reliant on a single industry. Diversification, much like in an investment portfolio, is the best hedge against local volatility.
FAQs About Median Income and Urban Economies
1. How is median household income calculated in 2026?
It represents the middle value of all household earnings, which removes the bias of extreme outliers to show the average worker's reality.
2. Why do tech hubs consistently dominate median income rankings?
Tech hubs benefit from high demand, high skill roles that command premium global salaries, which flow into the local consumer economy.
3. Is nominal income sufficient to determine a city's prosperity?
No, it is essential to adjust the local cost of living to determine real disposable income and purchasing power.
4. How does the presence of elite universities impact a city?
Universities act as engines of human capital, attracting research investment and talent that sustains high income industries.
5. What are the best strategies for a small business in a high income city?
Focus on high end, niche products or services that appeal to affluent consumers who prioritize quality and specialized service.
6. How do I choose the best location for my franchise?
Evaluate the local franchise guide and align your product market fit with the income demographics of the target city.
7. Does government spending affect local median income?
Yes, cities with a heavy presence of federal agencies benefit from a stable, high income base that is resistant to market volatility.
8. What role do professional services play in affluent regions?
They provide the necessary infrastructure for complex corporate and legal operations, supporting the higher end white collar job market.
9. How do I stress test a business model for an expensive urban market?
Use professional financial tools to analyze rent, labor costs, and tax burdens before making any commitments.
10. Where can I find reliable, data backed city intelligence?
Platforms like Urblytica provide detailed rankings and economic analysis for US cities.
Put Your Brand in Front of Movers & Founders
Reach a high-intent relocation and business audience across thousands of cities. Claim your space today.
View Placement Rates →